
We are excited to announce the release of a brand new QFloors tool. It is called QView. Everyone knows the helpful information that our Quick View window provides at the bottom of the QFloors screen: a snapshot look at MTD Sales, Projected GP, Receivables, and Payables. This new application is like the Quick View window on steroids. It will compile management, financial, and other analytical reports and display them on a dashboard with colorful, easily-read and understood charts and graphs. Each user’s dashboard can be customized to that user. For example, the owner/CFO of a company would be able to see sensitive financial reports that a sales manager or product manager would not need access to.
This QView dashboard application is accessed through an internet browser. It can be available and running in the background while you are using QFloors. Most of the heavy lifting will be done by our server, which means you’ll be able to just enjoy the data without using very much of your memory/CPU resources on your computer. The numbers on the reports will be automatically refreshed regularly. This allows you to have up-to-date results on the dashboard that can be accessed at a glance. Some of the reports are interactive, meaning that you can change the parameters of the reports. Where possible, you will even be able to drill down on the details of the total amounts.
We have included a list of the various reports. We have also included screenshots of some examples of the reports to give you a flavor of the possibilities. Additional custom dashboards can also be added (upon request, for a fee).
This new dashboard application will only be available to High Performance users (those with more than 5 users) who are current on their maintenance plan. If you have the small business version of QFloors, you will need to update to High Performance in order to use the QView report dashboard.
The cost of QView will be $50 per month per user. Most companies will only need one user.
Contact our sales department for more information and to see a quick demo of this new tool.
INCLUDED REPORTS
-
Total A/R (Accounts Receivable)(Bar Graph)
-
Filters
- Date
- Location
- Net Due
-
Filters
-
Total A/P (Accounts Payable)
-
Filters
- Weekday
- Location
-
Filters
-
Sales Comparison (Last 5 Years)
-
Filters
- Date
- Location
- Profit Center
- Month
-
Filters
-
Liquidity Ratios
- Avg. Days Sales Outstanding (DSO) → Avg daily revenue from sales
- Quick Ratio
- Current Ratio
- Days Payable
-
Financial Ratios
- Gross Profit (Total + %)
- Net Profit (Total + %)
- Return on Assets
-
Turnover Ratios
- Inventory Turnover
-
Bank Balances
- Bank Account Name + Balance
-
Sales Totals
- Pie Chart
- Filters
- Date
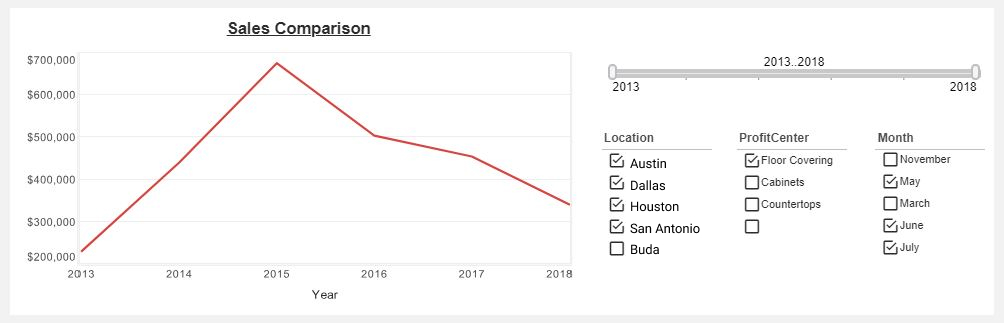 Sales Comparison Report
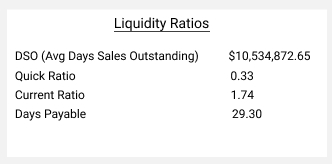 Liquidity Ratios Report
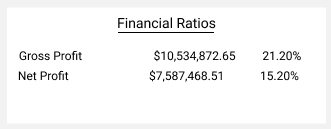 Financial Ratios Report
 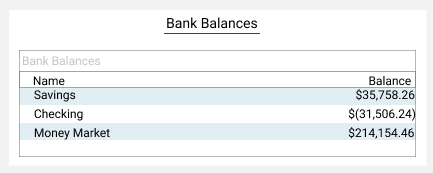 Bank Balances Report
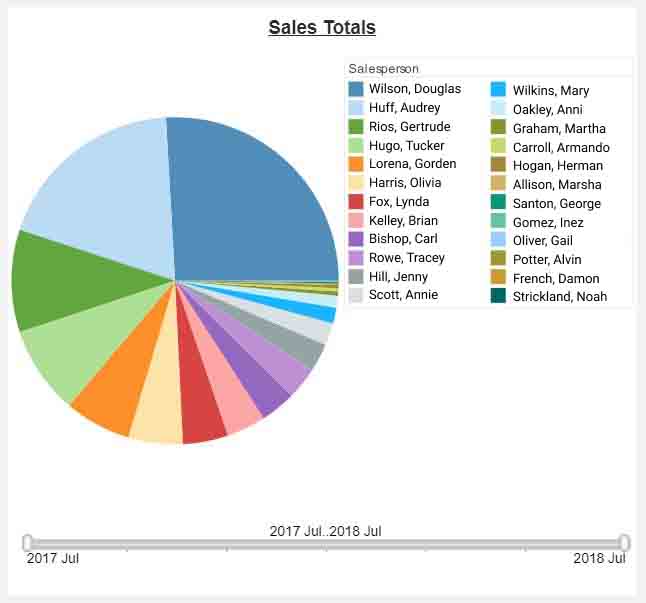 Sales Totals Report